Key Performance Indicators (KPIs)
KPIs give you an instant view of how your business is performing during the selected period.
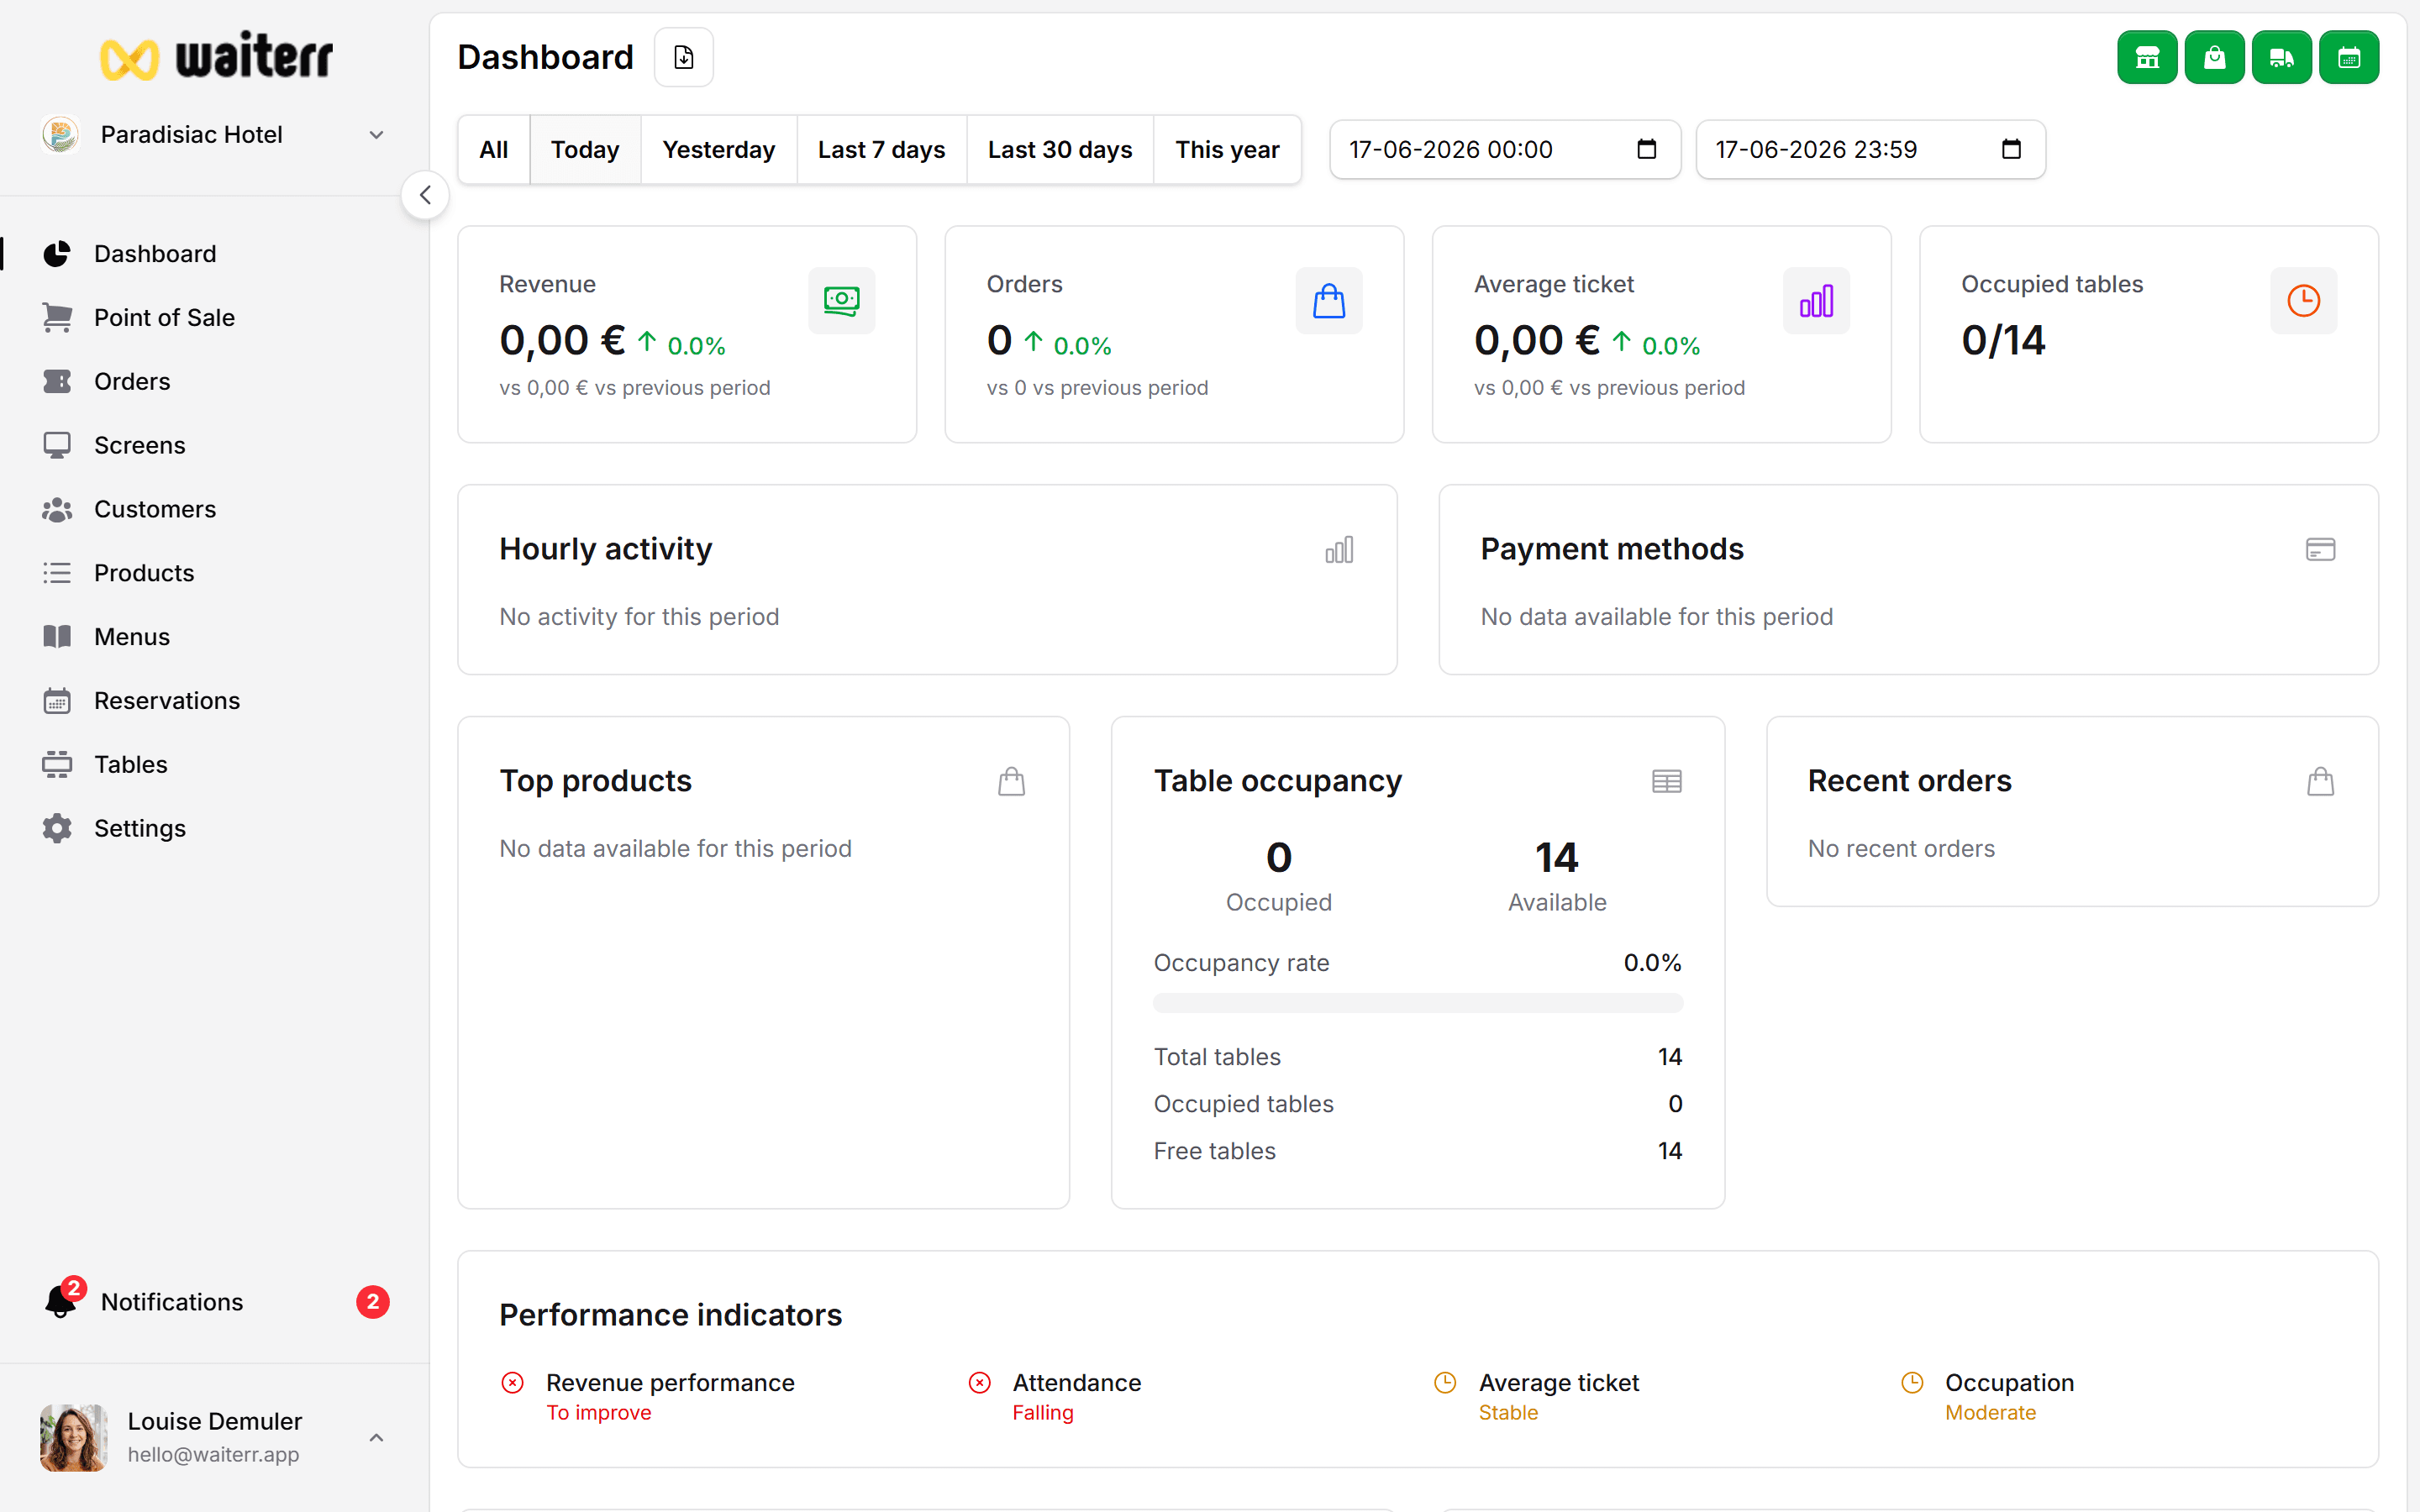
Available KPIs
Here are the KPIs you will see:
💶 Revenue (Turnover)
The total amount earned from all orders during the selected period.
- Includes all order types (POS, QR, takeaway, delivery)
- Includes taxes depending on configuration
- Updates instantly as new orders come in
🧾 Number of Orders
Total number of orders for the selected period.
This allows you to measure:
- Demand
- Peaks of activity
- Trends over time
💳 Average Ticket Value
Average value per order:
Average Ticket = Total Revenue / Number of Orders
Useful for tracking the impact of:
- Upselling
- Menu price changes
- Promotions
🍽 Table Occupancy
Shows how many tables were occupied during the selected period.
Only applies if you use:
- Table plans
- QR ordering per table
- Dine-in service
⏱ Activity per Hour
Displays orders volume by hour.
Ideal to identify busy hours in:
- Lunch service
- Dinner service
- Events
- Bars & clubs
Learn more:
👉 Charts & Insights
Related Pages
Last updated on